Asia/Manila
Projects2026

Telecom Churn Prediction

Telecom Churn Prediction
An end-to-end churn analysis for a telecom operator, read as one narrative: EDA to discover the business problem, retention segmentation, an XGBoost risk model, and a 'Renewal Rescue System' proposal — framed through a Philippine/ASEAN market lens.
  • Role: Data analyst
  • Context: End-to-end churn analysis
  • Scale: 100,000 customer records
  • Result: 78% churn in the highest-risk decile
  • 100K Customers analyzed
  • 0.69 Model ROC-AUC
  • 78% Top-decile churn rate
A telecom operator ('Company A') was losing customers but had no way to tell who was about to leave. With churn near 50% of the test base, blanket retention spend was wasteful. The task was to move from raw usage and demographic data to a prioritized, defensible answer for who to target and why — not just a model, but a business case. I merged two source tables — a client table (demographics, equipment, revenue) and a records table (usage, tenure, churn) — into a single 100,000-row, ~100-column modeling set, inner-joined 1:1 on Customer_ID. Exploratory analysis surfaced the real story: churners' median monthly revenue (47.49) barely trailed stayers' (48.88), and the sharpest risk clustered in the 11–12 month renewal window. From there I built rule-based retention segments (the riskiest being 'Renewal + silent-switching risk'), trained an XGBoost classifier, and translated its scores into risk tiers to drive a targeted 'Renewal Rescue System' proposal. Python · pandas · NumPy · scikit-learn · XGBoost · Matplotlib · Seaborn Wrapped median/most-frequent imputation and one-hot encoding inside an sklearn Pipeline and ColumnTransformer so every transform is fit only on training folds. With ~100 mixed numeric and categorical columns and meaningful missingness, this kept preprocessing reproducible and prevented data leakage from bleeding into the reported metrics.
Python
def build_churn_pipeline(X):
    numeric_features = X.select_dtypes(include=["number", "bool"]).columns.tolist()
    categorical_features = X.select_dtypes(include=["object", "category"]).columns.tolist()

    preprocessor = ColumnTransformer(transformers=[
        ("num", SimpleImputer(strategy="median"), numeric_features),
        ("cat", Pipeline([
            ("imputer", SimpleImputer(strategy="most_frequent")),
            ("onehot", OneHotEncoder(handle_unknown="ignore")),
        ]), categorical_features),
    ])

    model = XGBClassifier(
        n_estimators=250, max_depth=4, learning_rate=0.05,
        subsample=0.9, colsample_bytree=0.9,
        eval_metric="logloss", random_state=42, n_jobs=-1,
    )

    return Pipeline([("preprocess", preprocessor), ("model", model)])
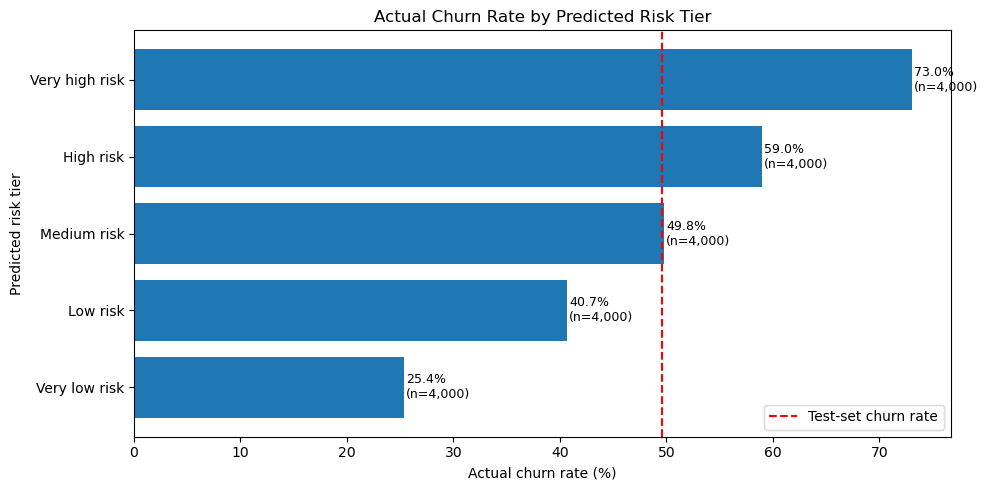
A ~0.69 ROC-AUC is modest on its own, so I reframed evaluation around prioritization. Ranking customers by predicted risk, the top decile captured a ~78% actual churn rate and the 'Very high risk' tier hit 73% versus a ~50% baseline. The argument: for a finite retention budget, who you target first matters more than a marginal AUC gain. Optimized the story around top-decile lift and risk banding rather than chasing a higher AUC. This maps directly to how a retention team spends a fixed budget, but it means the model is a triage tool, not a precise per-customer probability. Missing values clustered in demographic and equipment fields, so I treated data reliability as a finding rather than blanket-imputing it away. That preserved an honest narrative but left some features weaker predictors than a heavier imputation strategy might have forced.
  • Turned 100,000 customer records into risk tiers a retention team could use to prioritize a fixed budget.
  • The highest-risk decile recorded a 78% churn rate, making prioritization more useful than a blanket campaign.
  • The model is appropriate as a triage tool; production use would require live validation and drift monitoring.
Source code

Related projects

Meera

Meera

An agentic AI front door for university service desks: concerns arrive in plain language, get parsed and classified, are resolved automatically where possible, and routed to the right team when not. Top 3 of 100+ teams at the KPMG Academic Innovation Challenge.
Academic Ally

Academic Ally

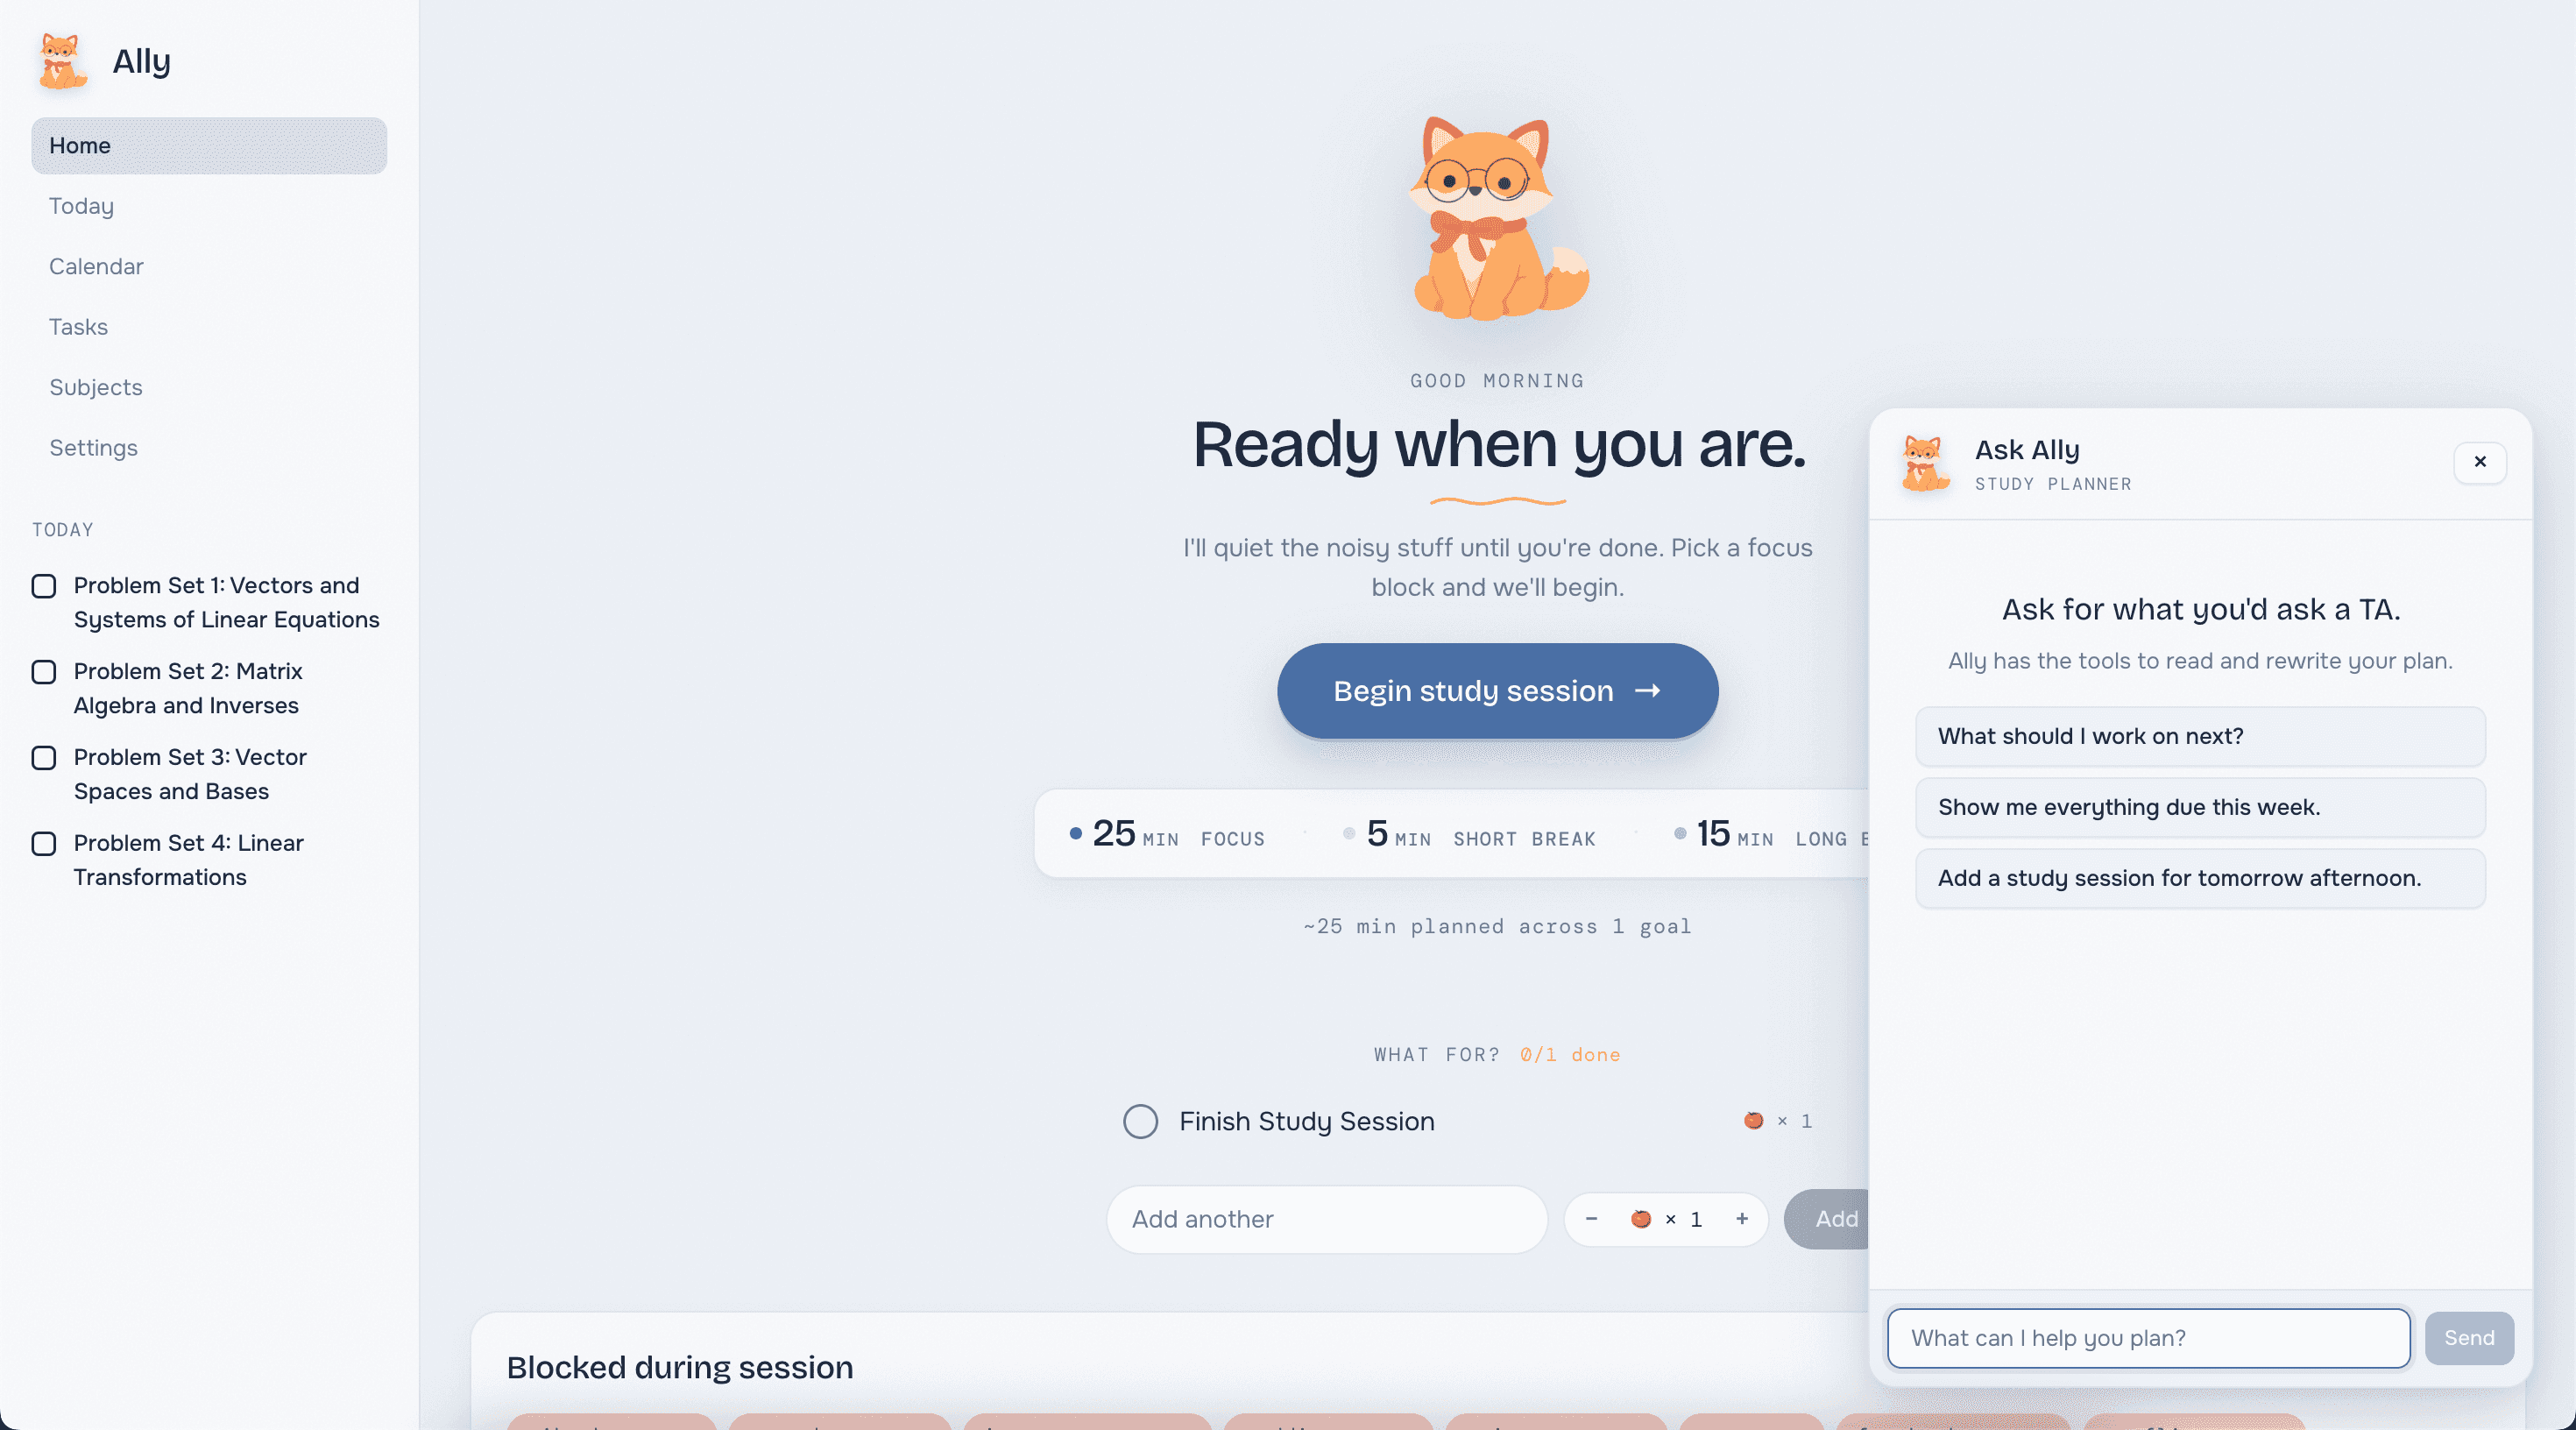
An agentic study platform: students upload course syllabi and it auto-plans their semester, with built-in focus sessions and integrated task and project management. Powered our Round 1 submission into the top 10 of the KPMG Academic Innovation Challenge.
Mayumi Cards

Mayumi Cards

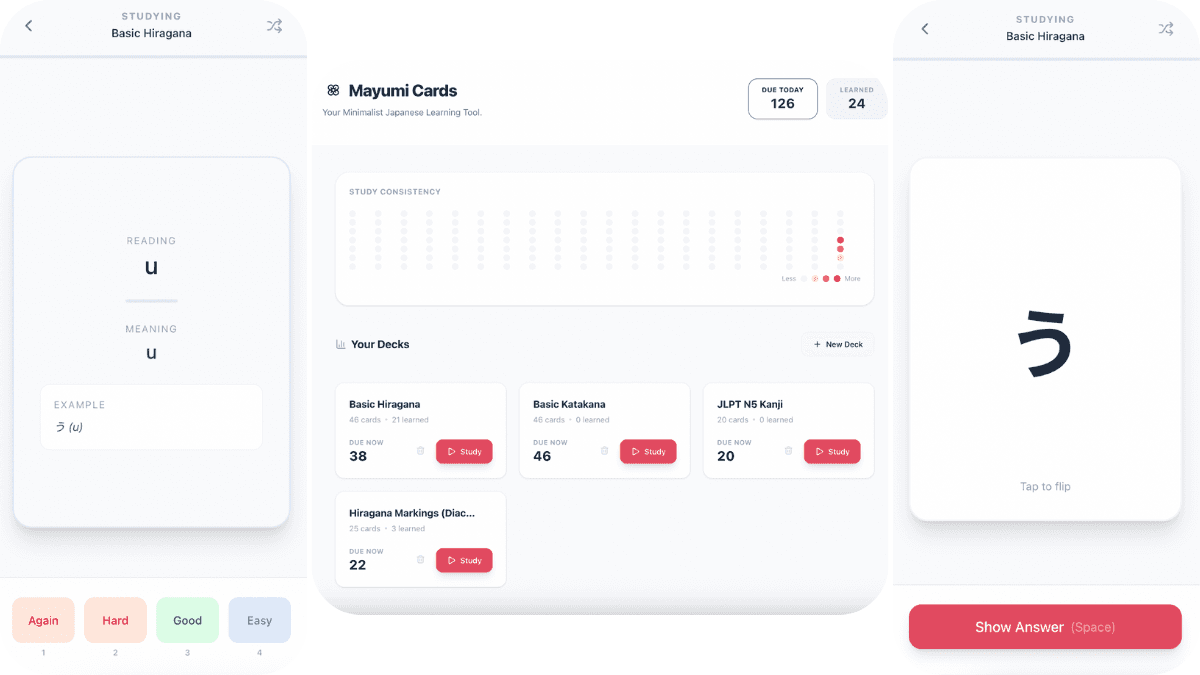
A Japanese flashcard app built around a client-side SRS algorithm. The hard part wasn't the UI — it was tuning the review-interval policy so daily study actually compounds.
Benkyō

Benkyō

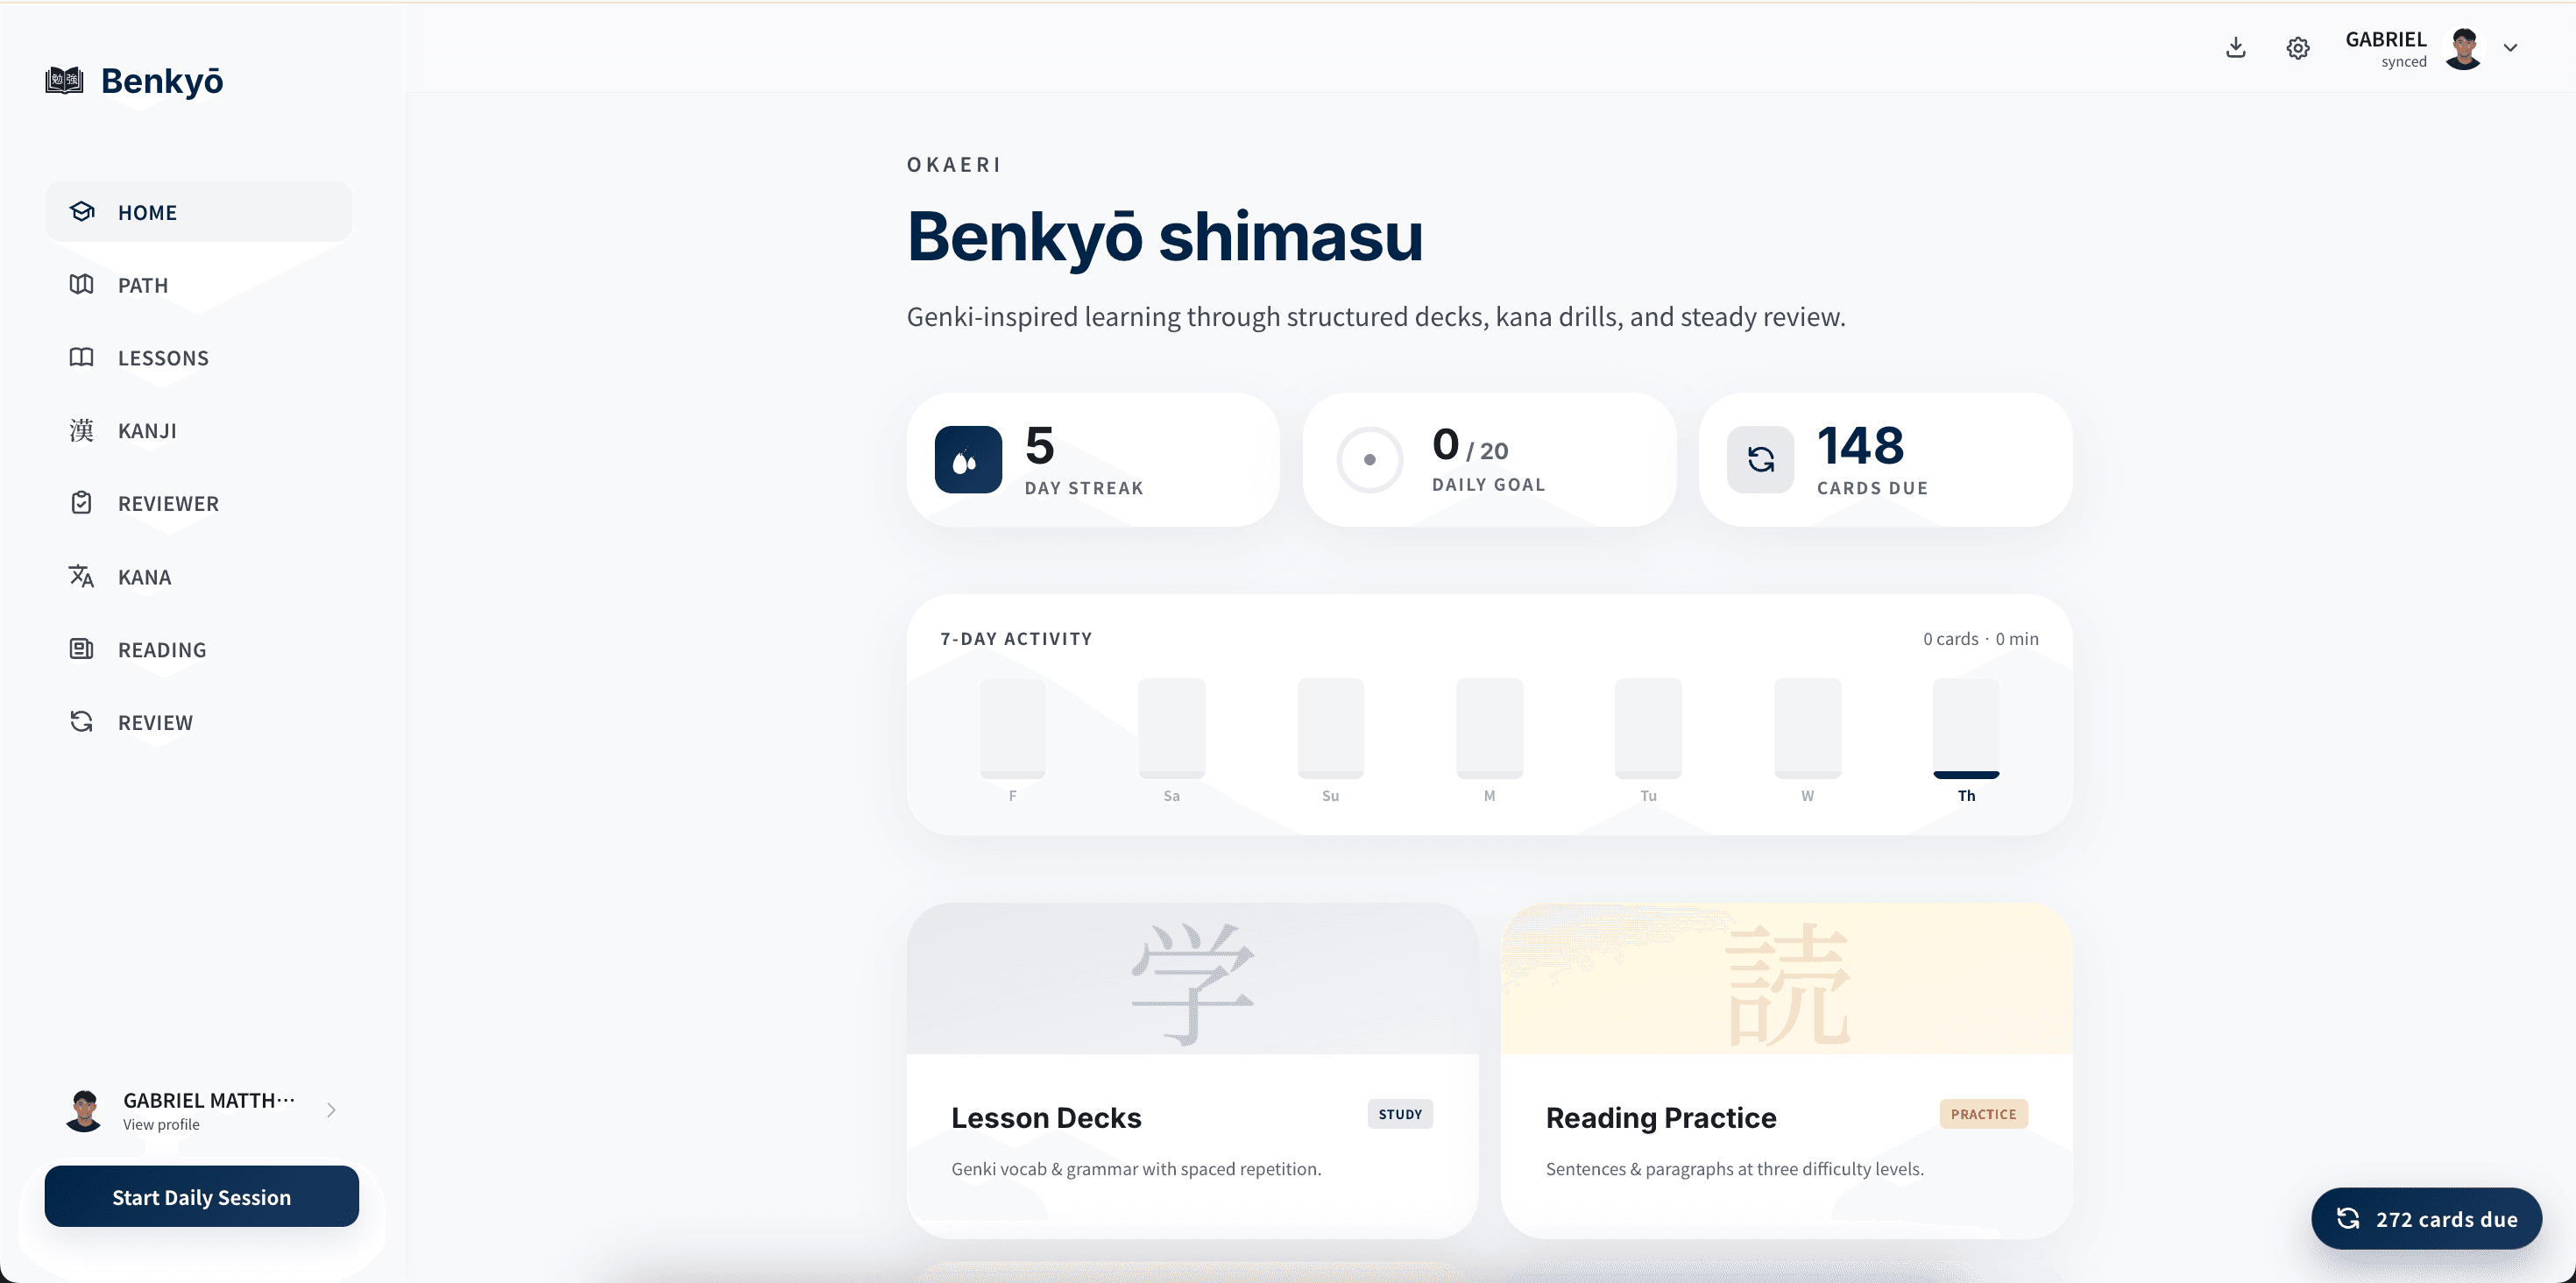
A spaced-repetition Japanese learning platform built for Ateneo's Introduction to Japanese 11 class. Schedules vocabulary reviews around retention patterns and tracks daily study streaks — serving 50 real students.